ご存じPythonの得意分野は
- データ処理
- データ可視化
- 機械学習
- AI
でしょう。
この中のデータ可視化を勉強してゆきます。
わたしはシステム開発では結構なベテランですがWEBアプリやPythonは勉強中の身です。いっしょに勉強してゆきましょう。
まず、開発環境は
Docker + VisualStudio Code で快適な Jupyter 環境をつくる
ここで紹介しました、VSCode上のJupyterを使います。この環境には
numpy matplotlib pandas
がインストールされています。まずはこれらのライブラリを使ったグラフを試してみましょう。
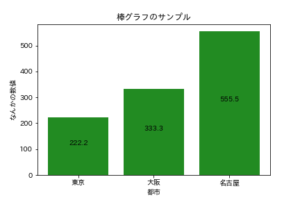
簡単な棒グラフから
import matplotlib.pyplot as plt

    location = ['東京', '大阪', '名古屋']
    testdata = [222.2, 333.3, 555.5]

    # 装飾
    # グラフのタイトルをつける
    plt.title('棒グラフのサンプル')

    # 軸ラベルをつける
    plt.xlabel('都市')
    plt.ylabel('なんかの数値')

    # 数値をつける
    for i in range(3):
        plt.text(i, testdata[i]/2,testdata[i], ha='center', va='bottom', color='black')
        # plt.text(i, testdata[i],testdata[i], ha='center', va='bottom', color='red')

    # Barの色を指定
    plt.bar(location, testdata, color='forestgreen')
    # plt.bar(location, testdata, color='yellow')

    #plt.show()
    plt.savefig('barTest1.png')

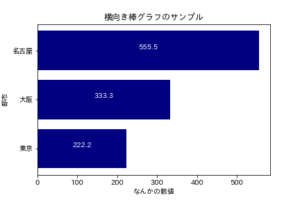
横向き棒グラフから
import matplotlib.pyplot as plt


location = ['東京', '大阪', '名古屋']
testdata = [222.2, 333.3, 555.5]

# 装飾
# グラフのタイトルをつける
plt.title('横向き棒グラフのサンプル')

# 軸ラベルをつける
plt.ylabel('都市')
plt.xlabel('なんかの数値')

# 数値をつける
for i in range(3):
    plt.text(testdata[i]/2, i, testdata[i], ha='center', va='bottom', color='white')

# Barの色を指定
plt.barh(location, testdata, tick_label=location, color='navy')

#plt.show()
plt.savefig('barTest1.png')


コメント